Reading Bitcoin On-Chain Data as a Miner — Key Metrics to Watch
The 6 on-chain metrics every miner should check weekly — hashrate, difficulty, hashprice, mempool size, miner reserves, and hash ribbons — and what each signals.

Bitcoin on-chain data for miners is a short list of public numbers — hashrate, difficulty, hashprice, mempool size, miner reserves, and hash ribbons — that together describe whether mining is currently profitable, stressed, or recovering. You do not need paid analytics. A weekly five-minute glance at four free dashboards is enough to calibrate how much hashrate you rent and for how long.
Why miners should care about on-chain data
Cloud mining P&L is not a mystery. It is a function of a handful of variables that anyone with a browser can see: the total hashrate competing against your machines, the difficulty of the puzzle each block must solve, the fee pressure in the mempool, and how stressed other miners are as a group. All of these are recorded on the Bitcoin blockchain or derived directly from it.
The reason to watch is not to trade Bitcoin — it is to calibrate your rental. Should you add another Pro Miner this month, or wait? Should you sign a 12-month term at a 15% discount, or stay flexible at month-to-month pricing? On-chain data turns those questions from guesses into informed choices.
The cadence matters too. Checking daily creates noise and leads to overtrading your plan. Checking never leaves you flying blind into a difficulty spike or a halving adjustment. A weekly rhythm is the sweet spot — fresh enough to catch regime shifts, slow enough to ignore day-to-day wiggle.
The 6 metrics at a glance
1. Network hashrate
Where: CoinWarz, Blockchain.com
Normal: ~1 ZH/s baseline in 2026. Rising = more competition; falling = miner capitulation.
2. Difficulty
Where: CoinWarz, Blockchain.com
Normal: ~135 T in 2026. Adjusts every 2,016 blocks (~2 weeks). Spikes >+5% cut your BTC output.
3. Hashprice
Where: Hashrate Index
Normal: $30–$55 per PH/s/day in 2026. Single best one-number summary of mining profitability.
4. Mempool & fees
Where: mempool.space
Normal: <50 MB, 5–20 sat/vB. High fees signal a bonus-revenue window for miners.
5. Miner reserves
Where: Glassnode, CryptoQuant
Normal: gradual drift. Sustained outflows to exchanges signal cashflow stress at miner level.
6. Hash ribbon
Where: Glassnode
Normal: short-MA above long-MA. Crossovers mark miner capitulation and recovery.
Metric #1: Network hashrate
Network hashrate is the total computing power of every miner on Bitcoin combined, measured in exahashes per second (EH/s) or, as of 2026, sometimes zettahashes per second (ZH/s — one ZH/s is 1,000 EH/s). You can read it on Blockchain.com's hash rate chart or CoinWarz — both are free and update hourly.
Why it matters for you: your rented TH/s earns a share of block rewards proportional to your slice of total hashrate. When total hashrate rises, your slice shrinks — the same 350 TH/s Pro Miner earns slightly less BTC. When hashrate falls, your slice grows.
What to watch: look at the 90-day trend, not the last day. Smooth rises of a few percent per month are normal — the network grows as new machines come online. A sustained drop of 10–20% over a few weeks is rare and meaningful; it usually means a batch of inefficient miners turned off because their electricity costs exceeded their BTC revenue. That "capitulation" is generally bullish for the miners who stay on — there is less competition per block until new machines refill the gap.
Metric #2: Difficulty
Difficulty is the parameter Bitcoin automatically adjusts every 2,016 blocks — roughly every two weeks — to keep block time near 10 minutes even as hashrate changes. In 2026 it sits around 135 trillion (T). Same tools: CoinWarz, Blockchain.com. Hashrate and difficulty move together, but not instantly — difficulty lags by design.
Plain-English interpretation: if difficulty rises 5%, each TH/s produces 5% less BTC for the next two-week epoch. If difficulty drops, each TH/s produces more. The largest recorded downward adjustment was -16% in March 2020 during the COVID crash — miners who stayed online saw their BTC output jump overnight.
In the current era, adjustments of ±1% to ±4% are typical. A +5% or larger adjustment deserves attention; it usually follows a period of fast hashrate growth and means your next two-week BTC output will visibly dip. A rare negative adjustment is a short-term tailwind. Neither is a reason to panic-cancel a plan — but they are useful inputs when sizing your next rental.
Metric #3: Hashprice
Hashprice is the single best one-number summary of mining profitability. It tells you how much USD revenue a petahash of hashrate earns per day, combining BTC price, difficulty, block reward, and transaction fees into one figure. The reference source is Hashrate Index, which publishes it daily for free.
As of 2026, typical hashprice runs between $30 and $55 per PH/s per day. Below $30 is a stressed regime — many older machines stop being profitable, and cloud mining margins compress. Above $50 is a strong regime where almost everything onchain is going right at once: high BTC price, stable difficulty, or elevated fee revenue.
How to use it: track the 12-month high, low, and midpoint. When hashprice is in the bottom third of that range, you are buying hashrate cheap in USD terms, which historically has preceded stronger periods. When it is in the top third, you are buying hashrate into a hot market — still productive, but less favorable entry. Our team inside the NoxHash NOC checks hashprice every morning because it moves our fleet-level expectations for the day; for a cloud mining user, weekly is plenty.
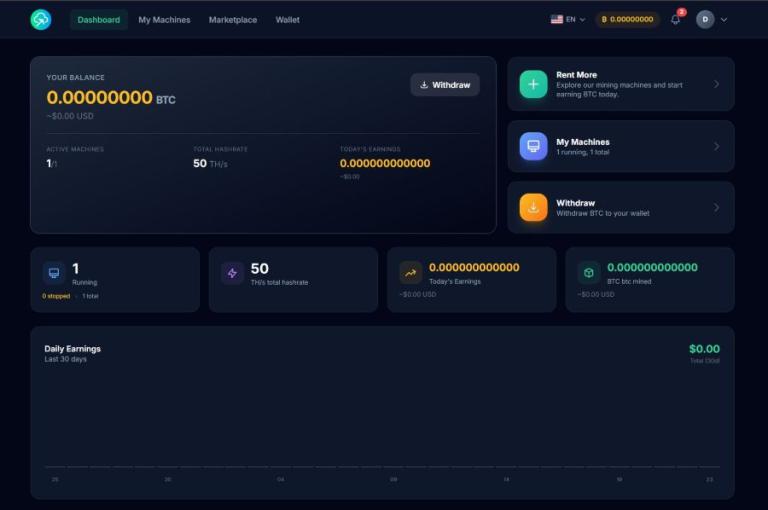
Put hashprice into practice inside your dashboard
The three metrics you just read — hashrate, difficulty, and hashprice — are easier to act on when you can see your own earnings next to them. Open a NoxHash account and compare the public numbers with the BTC actually flowing into your wallet.
Metric #4: Mempool size and fee pressure
The mempool is the queue of pending Bitcoin transactions waiting to be included in a block. You can watch it live at mempool.space — it shows the queue in megabytes and the current fee rates in sat/vB (satoshis per virtual byte).
In calm periods, mempool size sits under 50 MB and fees hover between 5 and 20 sat/vB. In congested periods — often during BTC price rallies, ordinal or runes mints, or exchange activity — the mempool can balloon past 200 MB and fees can spike to 100 sat/vB or higher. Miners pocket those fees on top of the 3.125 BTC block subsidy, so congested periods are bonus-revenue windows.
This is not a predictor — mempool congestion can appear and vanish over a few days. Treat it as a pulse check. If mempool.space shows a sustained high fee environment for more than a week, expect your hashprice and BTC output to run above the baseline for as long as it lasts. If you want a deeper read on this specific metric, our sibling article on how mempool congestion creates bonus revenue for miners covers just that lens.
Metric #5: Miner reserves on exchanges
Every Bitcoin address is public. Analytics providers like Glassnode and CryptoQuant label known miner-controlled addresses and track the flow of BTC from those wallets to exchange deposit addresses. A rising flow of miner BTC into exchanges typically means miners are preparing to sell — usually because their USD cash costs (electricity, payroll, loan servicing) are running ahead of their BTC income.
You can read a simplified version of this metric on the free tiers of both platforms; the chart is usually called "miner to exchange flow" or "miner reserves". A steady downward trend in miner reserves — meaning BTC leaves miner wallets and hits exchanges — is a stress signal.
Historically, sustained miner selling has coincided with local BTC price bottoms. Not because miners predict prices, but because weaker operations are forced to liquidate when the market is already weak. For you as a cloud mining user, the practical read is: when miner reserves are draining into exchanges, the industry is under pressure, and rental pricing tends to soften. For long-horizon buyers, that has often been a reasonable entry window.
Metric #6: Hash ribbon
The hash ribbon is a simple derived indicator: it plots the 30-day moving average of network hashrate alongside the 60-day moving average. Glassnode and TradingView both publish it — search "hash ribbon indicator". The signal everyone watches is the crossover.
When the short (30-day) line drops below the long (60-day) line, miners are capitulating — enough machines have switched off that the 30-day average now lags the 60-day. When the short line crosses back above the long line, the worst of the capitulation is over and the recovery phase has started. Charlie Morris, who introduced the concept, and later research from Capriole have documented that historically, the recovery crossover has preceded stronger Bitcoin performance over the following 3–6 months.
How to use it: treat it as a regime indicator, not a trading trigger. If hash ribbon is in "recovery" territory, you are operating in a historically favorable environment. If it is in "capitulation" territory, you are in a stressed regime — a case for holding sizing steady or leaning into longer-term plans where discounts are better. It is one input among several, not a crystal ball.
How to read the signals in practice
The table below summarizes the typical value ranges for each metric in 2026 and the practical calibration on NoxHash. These are heuristics, not guarantees — every rental decision should still factor your personal risk appetite and the reminders in the disclaimer at the end.
| Metric | Value range | Practical NoxHash calibration |
|---|---|---|
| Hashrate trend | Sustained drop >10% | Stressed regime. Consider longer-term plans (6–12 months) to lock the 10–15% discount. |
| Difficulty | Adjustment >+5% | Expect BTC output to dip next epoch. Not a reason to cancel; factor into expectations. |
| Hashprice | Below $30 / PH/s / day | Buying hashrate cheap in USD terms. Historically favorable entry for long horizons. |
| Hashprice | Above $50 / PH/s / day | Hot market. Still productive but less favorable entry; size smaller if new. |
| Mempool fees | Sustained >50 sat/vB | Bonus-revenue window. Baseline BTC output trends above normal while it lasts. |
| Miner reserves | Sustained outflows to exchanges | Industry under cashflow stress. Often coincides with local BTC bottoms. |
| Hash ribbon | Recovery crossover (30d > 60d) | Historically favorable regime. Steady sizing; do not chase. |
A weekly 5-minute routine
You do not need to sit in front of charts every day. A single sweep on Sunday evening — four tabs, five minutes — is enough to catch regime shifts before they matter. Do it at the same time each week so you are comparing like to like.
Open Hashrate Index (hashprice)
Look at today's hashprice and the 12-month chart. Where is it in the range — top, middle, or bottom third?
Open CoinWarz (hashrate + difficulty)
Check the 90-day hashrate trend and the last difficulty adjustment. Any spike above +5% or drop below -5%?
Open mempool.space (fee pulse)
Glance at pending MB and the current sat/vB tiers. Calm (under 20) or elevated (over 50)?
Open Glassnode free dashboard (miner reserves)
Look at miner-to-exchange flow and hash ribbon. Which regime are we in — stress, neutral, or recovery?
Do not check daily. The daily wiggle is noise, and looking at it tempts over-reactive decisions. The point of a weekly rhythm is that it gives you signal with minimum emotional interference. Write the readings down in a plain note — over 10 or 12 weeks, patterns become visible that a single glance will never reveal.
Common mistakes to avoid
Start with hashprice, not price
BTC price alone tells you little about mining profitability. Hashprice already bakes in difficulty and fees — it is the more honest single number for a miner.
Weekly, not daily
Daily checking creates noise and emotional decisions. A weekly rhythm captures real regime shifts without burning time or nerves.
One metric is never enough
Hashprice can be hot while hash ribbon signals stress. Always read at least three metrics together — singleton signals lie more often than dashboards do.
Paid tools are optional
Hashrate Index, CoinWarz, mempool.space, and the Glassnode free tier cover everything in this article. Pay for deeper analytics only if you manage a large fleet.
Pair the dashboards with a real rental
Reading on-chain data is more useful when you can match it to your own BTC output. Start with a 2-day free trial on a Basic Miner, or pick any tier and watch the metrics you just learned move alongside your dashboard earnings.
Frequently asked questions
Do I need paid data tools like Glassnode Pro to watch these metrics?
No. Hashrate Index, CoinWarz, Blockchain.com, mempool.space, and Glassnode's free tier cover every metric in this article. Paid analytics only start paying back if you manage a large self-owned fleet. For a cloud mining user, the free stack is sufficient.
What is the difference between hashrate and difficulty?
Hashrate is the total computing power actively mining Bitcoin, measured in EH/s. Difficulty is the parameter the protocol adjusts every 2,016 blocks so blocks keep arriving roughly every 10 minutes despite hashrate changes. Hashrate is the input; difficulty is the response.
Can I predict BTC price from these on-chain metrics?
No, and that is not the point. These metrics describe mining economics, not price. Some of them have historically coincided with price turning points — miner capitulation often occurs near local bottoms — but correlation is not prediction. Use them to calibrate rentals, not to trade BTC.
Is the hash ribbon indicator reliable?
Historically, hash ribbon recovery crossovers have preceded stronger Bitcoin performance over 3–6 months. The sample size is small — four to five halving cycles — so treat it as a regime indicator rather than a guaranteed signal. Combine it with hashprice and miner reserves for a clearer read.
How does the NoxHash fleet affect my share of network hashrate?
Your rented TH/s earns a proportional share of block rewards mined by the NoxHash fleet, which pools into FPPS mining pools. Your share of network hashrate is your TH/s divided by total network hashrate — currently around 1 ZH/s. A 350 TH/s Pro Miner is roughly 0.000035% of the network.
Which single metric should I start with if I only have time for one?
Hashprice. It already bakes BTC price, difficulty, block reward, and fee revenue into one number, updated daily on Hashrate Index. If hashprice is in the bottom third of its 12-month range, conditions are favorable for long-horizon entries. If it is in the top third, be more cautious with sizing.
How often does the Bitcoin difficulty actually adjust?
Every 2,016 blocks, which works out to roughly every two weeks at the target 10-minute block time. In practice the gap ranges from about 12 to 16 days depending on how close to target the preceding epoch ran. Countdown timers on CoinWarz and mempool.space show the next expected adjustment.
This is not investment advice
The metrics and ranges in this article are educational. Historical patterns do not guarantee future outcomes; Bitcoin price, difficulty, and fee revenue can move sharply and unpredictably. Do your own research and only commit capital you can afford to lose. Mining economics depend on variables outside the control of any platform or user.