Bitcoin Price Crashes and Mining — What History Teaches Us
Four Bitcoin crashes — 2018, March 2020, 2022, post-halving 2024 — and what each one did to miners. Hashrate, hashprice, and capitulation, honestly.

Bitcoin has crashed four times in ways that directly reshaped mining economics — 2018, March 2020, 2022, and the slow post-halving grind of 2024. Each crash followed a recognizable pattern: BTC fell first, hashprice collapsed second, inefficient fleets shut down third, and survivors emerged with lower costs and stronger balance sheets. The details differ, but the lessons for renters rhyme.
Why BTC Crashes Hit Miners Harder Than Holders
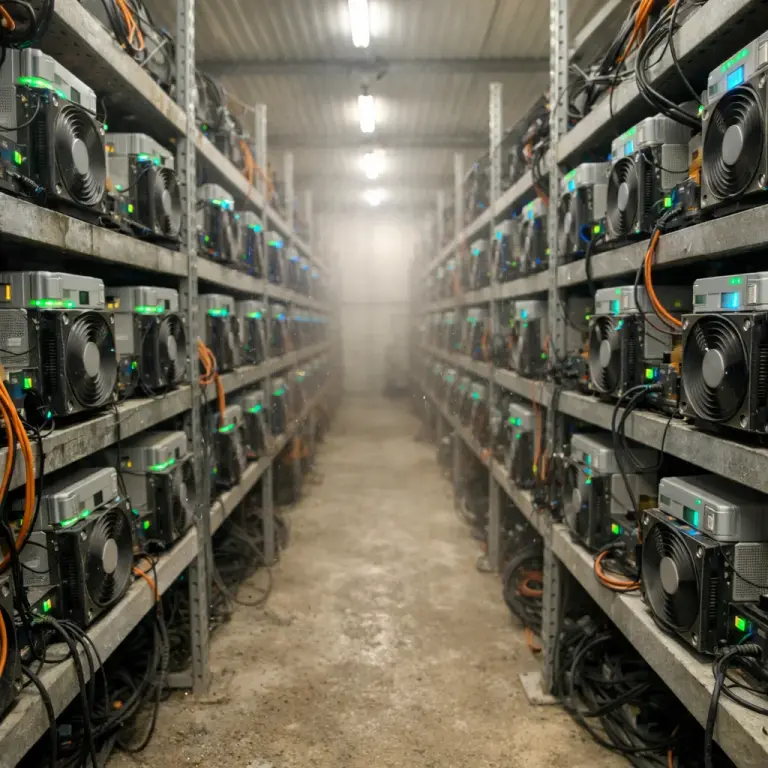
A holder watching BTC fall 40% has one problem: their portfolio is worth 40% less on paper. A miner watching the same 40% drop has two problems. Their BTC production is worth 40% less in USD, and the USD costs that produced it — electricity, hosting, rental fees — did not move. That asymmetry is the central fact of mining through a bear market.
For a cloud mining renter the effect is even sharper. The rental fee is priced in USD on a fixed monthly schedule, while every satoshi mined is worth whatever BTC trades at the moment it lands on the dashboard. When BTC falls faster than network difficulty can adjust, the ratio of USD output to USD cost compresses in real time. History shows this compression ends in exactly one way: high-cost capacity leaves the network until equilibrium returns. The rest of this article walks through how that played out, four times.
Case Study 1: The 2018 Bear — A Slow 84% Bleed
The 2018 bear market was the first crash that tested an industrial-scale mining economy. BTC peaked near $19,700 in December 2017, and by December 2018 it had traded as low as roughly $3,200 — an 84% drawdown spread over twelve grinding months. Unlike later flash crashes, this one killed miners slowly.
The hashrate response is documented on Blockchain.com's long-run hashrate chart: the network climbed to a local peak near ~55 EH/s in late summer 2018, then fell to roughly ~35 EH/s by December — a 35% drop in three months. The reason was the machine fleet of the era. The dominant miner was the Antminer S9, released 2016, running at roughly 95 J/TH. At BTC $6,000 and typical residential or semi-industrial power rates, an S9 was borderline profitable; at BTC $3,500 it was a paperweight.
| Metric | Dec 2017 peak | Dec 2018 trough | Change |
|---|---|---|---|
| BTC price | ~$19,700 | ~$3,200 | -84% |
| Network hashrate | ~17 EH/s (year start) | ~35 EH/s (after capitulation) | -35% from Aug peak |
| Dominant ASIC | Antminer S9 (~95 J/TH) | S9 retired en masse | Fleet cost floor raised |
| Mining cycle stage | Pre-2020 halving | Block reward still 12.5 BTC | Reward intact, margins gone |
The 2018 lesson is the most durable one. In a slow bleed, energy efficiency alone decides who stays on the network. Miners at $0.03–0.05/kWh with modern hardware kept running. Miners on $0.08–0.12/kWh with older units turned off the lights. For a cloud mining renter watching this from the outside, the takeaway is that the facility you rent from has to be able to keep operating profitably at far lower BTC prices than you personally care about — because if the facility cannot, your contract is worth the paper it is written on.
Case Study 2: March 2020 — A 50% Crash in Two Days
Everything about the March 2020 crash was fast. On 12–13 March 2020, during the global COVID-19 liquidity shock, BTC fell from roughly $10,000 to near $4,000 in about 36 hours — the fastest major drawdown in the asset's history up to that point. It was also short. Bitcoin was back above $7,000 within a month and above $10,000 by mid-year, so the 2020 crash tested how fast mining can break rather than how long it can stay broken.
The mining system's response was record-setting. The difficulty adjustment following the crash — on roughly 26 March 2020 per Blockchain.com's difficulty history — came in at approximately -16%, one of the largest downward adjustments ever recorded on the Bitcoin network. A 16% difficulty drop in a single adjustment is almost unheard of outside of a major China ban or a hashrate regime change; it meant that roughly one in six machines on the planet had powered off between adjustments, unable to sustain operation at the new price.
The miners who shut off were, predictably, the oldest and highest-cost. The crash pulled forward the S9 retirement cycle by about a year, clearing out high-J/TH capacity that had been marginally profitable on cheap power and pushing the average fleet efficiency noticeably lower. Operators with Antminer S17 and later machines — especially in Kazakhstan, Russia, and parts of North America — not only survived but picked up share as competitors dropped out.
For renters, the 2020 case illustrates a second lesson. Short, violent crashes hurt less than slow ones, provided the operator stays solvent through the week. A fleet that can keep running at BTC $4,000 has no trouble at BTC $6,000 or $8,000 — so once the crash bottomed and BTC began recovering, renters on well-run platforms saw yield normalize within one or two difficulty adjustments, while the fleets that had shut down were still trying to restart.
Case Study 3: The 2022 FTX/Luna Cycle — Public Miners on the Ropes
The 2022 bear market was where mining-as-a-public-company got its stress test. BTC peaked near $69,000 in November 2021 and bottomed around $15,700 in November 2022, a 77% drawdown stretched across twelve months. Layered on top were the Terra/Luna collapse (May 2022), the Three Arrows Capital implosion, and finally the FTX bankruptcy in November 2022. Unlike 2018, the miners hit hardest this time were not hobbyists but listed companies carrying debt.
The casualties are well documented in CoinDesk's coverage of miner bankruptcies. Compute North, once one of the largest hosting providers in North America, filed Chapter 11 in September 2022. Core Scientific, then the largest publicly listed Bitcoin miner in the world by hashrate, filed Chapter 11 in December 2022. Several smaller public miners restructured debt, diluted equity aggressively, or were acquired at distressed prices. The pattern was the same across the sector: machines purchased at 2021 prices on debt that had to be serviced in USD, revenue collapsing in USD terms, difficulty still grinding higher — a textbook margin squeeze.
| What failed in 2022 | Why |
|---|---|
| Heavily leveraged public miners | Machines bought at peak 2021 prices on debt; USD debt service survived the BTC drop, revenue did not |
| Hosting providers tied to single tenants | Customer defaults cascaded into power contracts the host still had to honor |
| Operators on short-term power contracts | Texas summer-2022 electricity spikes added insult — some paying $0.15+/kWh during heatwaves |
| Contracts funded in FTX-native stablecoins | Counterparty risk materialized suddenly with the exchange collapse |
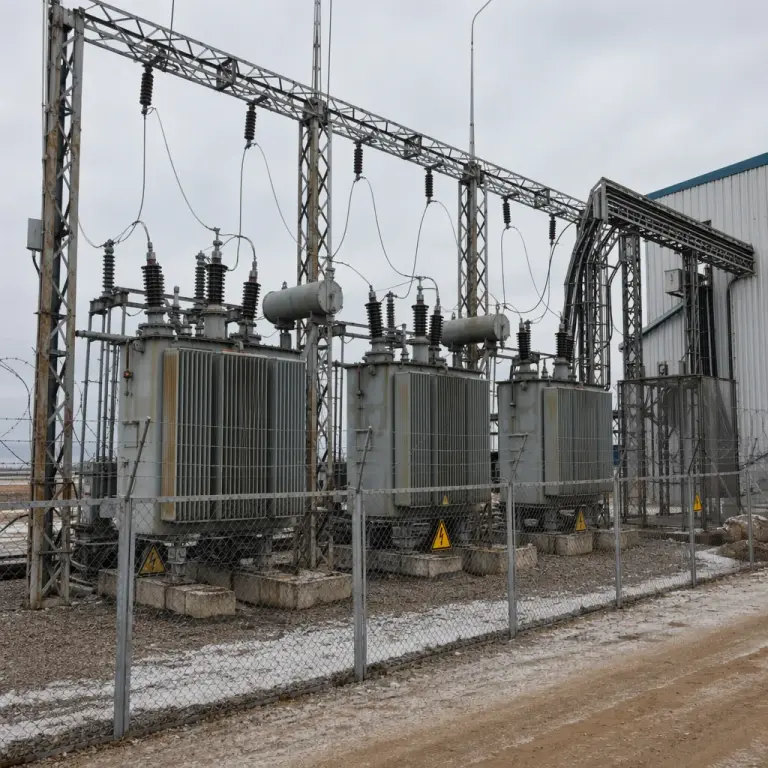
Meanwhile, the operators who survived shared a different profile: long-term industrial power contracts, a low-J/TH fleet, modest or no debt, and no exposure to FTX or Luna as counterparties. A Kazakhstan facility running S19 Pro and early S21 units at $0.035/kWh on a multi-year power contract had a very different experience from a Texas site on spot power with leveraged machine purchases. The 2022 lesson for renters is about counterparty geography and balance-sheet discipline, not just raw efficiency.
See the survivor profile that 2018, 2020, and 2022 all rewarded
The fleets that walked through every crash in the last decade shared four things: industrial power (NoxHash: $0.035/kWh, Kazakhstan), modern hardware (Antminer S21 series at 12–17.5 J/TH), no debt financing the machines, and no concentrated counterparty exposure. The 2-day free trial lets you look at that operator profile in practice — real 50 TH/s miner, live dashboard, zero deposit — before any USD leaves your account.
Case Study 4: The 2024–2025 Post-Halving Grind
The fourth crash is less a crash and more a slow compression, and it is still playing out in data as of April 2026. On 19–20 April 2024 Bitcoin's fourth halving cut the block reward from 6.25 BTC to 3.125 BTC, as documented on Blockchain.com's hashrate chart and the protocol itself. In past halvings, BTC price appreciation over the following twelve months had largely offset the reward cut for efficient miners. This cycle has been less forgiving.
Three things happened at once. First, transaction-fee revenue — briefly elevated by Ordinals and Runes activity in early 2024 — moderated through the year, so the fee cushion miners had hoped for proved uneven. Second, network hashrate kept climbing despite the halving, from roughly 600 EH/s pre-halving to approximately 1 ZH/s (1,000 EH/s) by early 2026 as new-generation S21 and WhatsMiner M6x machines came online. Third, even with BTC trading at multi-year highs for parts of 2024–2025, the combination of halved rewards and 60%+ more hashrate pushed hashprice into a persistent $30–$55 per PH/s/day band per the Hashrate Index hashprice chart — materially below the $80–$120 levels miners enjoyed in 2021.
| Metric | Pre-halving (early 2024) | Early 2026 baseline | Direction |
|---|---|---|---|
| Block reward | 6.25 BTC | 3.125 BTC | -50% overnight |
| Network hashrate | ~600 EH/s | ~1,000 EH/s (1 ZH/s) | +65% rise |
| Difficulty | ~83 T | ~135 T | +63% rise |
| Hashprice | ~$90–$120 / PH/s/day | ~$30–$55 / PH/s/day | -50–70% compression |
This is a different kind of stress from 2018 or 2022. BTC did not crash — hashprice did. Miners running 30+ J/TH fleets from earlier generations found themselves squeezed even while BTC made new highs, because every unit of BTC they produced was split across far more global hashrate. The 2024–2025 lesson is that "BTC up" and "mining profitable" are not the same statement anymore. What matters is your position within the global efficiency curve, not the headline BTC price.
For a cloud mining renter, this is exactly why modern-fleet access matters. A Basic Miner on a 12–17.5 J/TH S21-class machine earns meaningfully more BTC per dollar of rental fee than the same notional hashrate on a 30 J/TH legacy fleet would — and the gap widens every time hashprice compresses.
Pattern Lessons — What Always Survives, What Always Dies
Four crashes, four distinct shapes: slow bleed (2018), flash crash (2020), leveraged collapse (2022), structural compression (2024–2025). Very different triggers, but the survivor profile rhymes across every one of them. The tips below are the consolidated output of all four case studies.
Low-cost fleets always survive
Every crash killed high-J/TH, high-kWh-cost capacity first. Industrial power at $0.03–0.04/kWh combined with sub-20 J/TH hardware has been the consistent survival envelope across all four cycles.
Debt amplifies every crash
2022 was the clearest demonstration: machines bought at the top on USD debt became forced sellers into the bottom. Operators funded through retained earnings and platform revenue weathered the same drawdown without bankruptcy.
Contract timing matters
Renting a 12-month contract at the absolute top of a cycle means carrying a fixed USD cost through an accelerating drawdown. Short terms during uncertainty, longer terms after the worst repricing is visibly behind — discipline beats conviction.
Counterparty concentration kills
Miners heavily tied to a single exchange (FTX), a single power market (ERCOT summer 2022), or a single jurisdiction (China 2021) suffered the worst breakdowns. Geographic and commercial diversification is not a luxury — it is crash insurance.
Notice what is not on this list. "Pick the right bottom," "time the halving perfectly," "predict BTC price for the next twelve months" — none of these are survivor traits. The survivor traits are structural: cheap power, modern hardware, clean balance sheet, diversified counterparties. Every one is verifiable from outside the company, with no crystal ball required.
Verify the four crash-survivor traits on a real miner, free for 2 days
The pattern lessons above — low-cost power, modern fleet, no debt on the machines, no FTX-style counterparty concentration — are exactly the traits you can watch on a live NoxHash miner. Start with the 2-day Basic Miner trial, open the dashboard, and judge for yourself whether the operator profile matches the one that walked through 2018, 2020, 2022, and 2024 without going offline. No deposit, real hardware, honest disclaimers throughout.
Frequently Asked Questions
Did cloud mining as a category die in any of these crashes?
No — legitimate cloud mining has continued operating through every cycle. What dies in each crash is Ponzi-style operators with no real fleet plus undercapitalized legitimate operators that took on too much debt or signed bad power contracts. Real facilities with industrial power and modern hardware have kept running through 2018, 2020, 2022, and 2024.
How long did recoveries typically take?
BTC price recovery varied: March 2020 recovered within months, 2018 took until late 2020 to fully break out, and 2022 took about a year to reclaim prior highs. Hashrate recovery was faster — within a few difficulty adjustments — because surviving operators picked up the capacity that had shut off, so efficient fleets actually earned more BTC per TH during the recovery windows.
What is structurally different about the 2024–2025 cycle?
Hashrate kept climbing after the April 2024 halving even though the block reward was cut in half, so hashprice compressed even while BTC held up in USD terms. This is the first cycle where "BTC making highs" and "mining margins healthy" clearly decoupled — making fleet efficiency more decisive than headline BTC price for miner profitability.
Should I start cloud mining during a crash?
Cautiously, and with short contracts only. Renting during a visible downtrend means paying a fixed USD fee while the BTC you mine is losing dollar value daily. If you do enter during a drawdown, a Basic or Standard monthly plan is wiser than a 12-month lock, and sizing should be modest until the price tape stabilizes.
How can I tell if a cloud mining operator would survive the next crash?
Ask about four things: power cost per kWh (survivors are at $0.03–0.05), fleet efficiency (survivors are sub-20 J/TH), debt load on the hardware (survivors own machines outright or fund from operations), and counterparty diversification. An operator that answers all four transparently is far more likely to still be running at the next BTC bottom.
Do past mining cycles guarantee the next one will look similar?
No. Each of the four crashes looked different in shape, speed, and trigger, and the 2024–2025 hashprice compression was arguably a new pattern altogether. History offers structural lessons about which operator profiles survive, not timing or magnitude predictions about the next drawdown. Past performance does not guarantee future results.
Why did BTC recover fastest in March 2020 but slowest in 2018?
March 2020 was a liquidity event inside a broader macro shock — once global central banks added liquidity, risk assets including BTC recovered fast. 2018 was the unwind of a speculative retail-driven bubble with no comparable catalyst, so the grind-down was slower and the base-building phase longer. Different crash triggers produce different recovery timelines.
Historical analysis, not financial advice
This article is educational and does not constitute investment, tax, or legal advice. Historical BTC prices, hashrate levels, and difficulty values are rounded approximations based on publicly reported data and are intended to illustrate the scale of past events, not to substitute for primary sources. Past performance of Bitcoin or mining economics does not predict future results. Mining income depends on BTC price, network difficulty, hashprice, and operator conditions that can all change rapidly. Only commit funds you can afford to lose, consult a qualified crypto-aware accountant about your local tax treatment, and treat every projection in this article as illustrative rather than a guarantee.