Bitcoin Mining Profitability Report — Q1 2026
Q1 2026 Bitcoin mining retrospective: BTC -22.6%, hashprice under $33/PH, record +14.7% difficulty jump, and a 32,000 BTC public-miner sell-off.

Q1 2026 was the hardest quarter for Bitcoin miners since the 2024 halving. BTC opened near $87,700 on January 1 and closed around $67,500 on March 31, a -22.6% drop. Hashrate briefly topped 1 ZH/s, difficulty posted its biggest jump since 2021, and hashprice fell below $33/PH/day — crushing high-cost operators.
Q1 2026 at a Glance
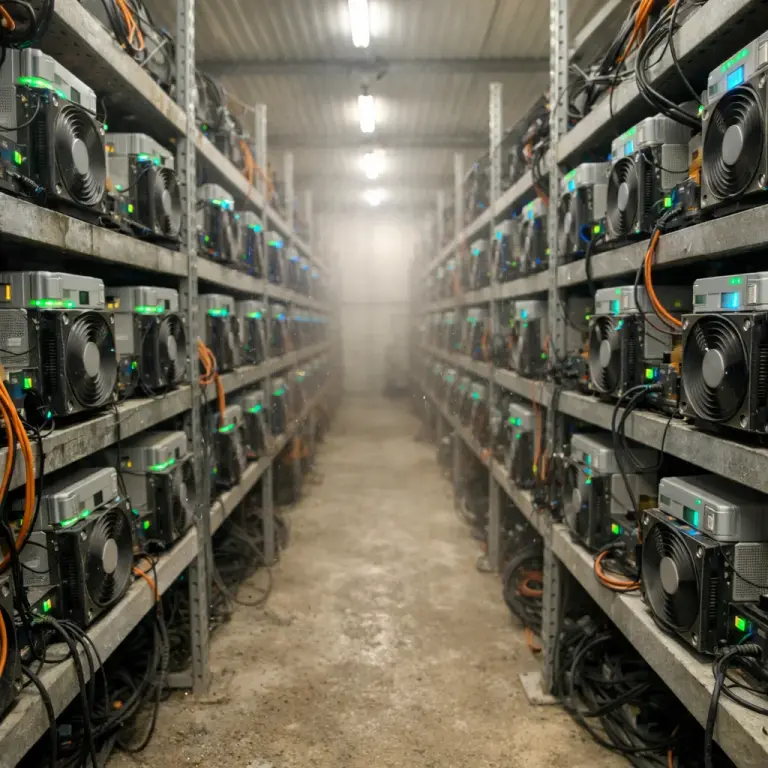
The quarter combined a sharp Bitcoin correction with a near-record difficulty regime, and it broke something in the miner economy. Public miners sold more BTC in three months than in all of 2025 combined. The table below is the 30-second version of Q1, built from CoinDesk, Hashrate Index and CoinShares Q1 2026 data.
| Metric | Start of Q1 | End of Q1 | Change |
|---|---|---|---|
| BTC price | ~$87,700 | ~$67,500 | −22.6% |
| Network hashrate (7-day avg) | ~1,020 EH/s | ~950 EH/s | −7% net |
| Difficulty | ~126 T | ~135 T | +7% (peaked 144.4 T Feb 19) |
| Hashprice | ~$42/PH/day | ~$29–33/PH/day | −25% to −30% |
| Public miner BTC sold | — | 32,000+ BTC | Record quarter (CoinShares, Apr 2026) |
Monthly breakdown for context: Bitcoin dropped -10.7% in January, -14.8% in February, then clawed back +0.19% in March after a brief relief rally. That shape — sharp down then chop — is what drove the hashprice collapse even as hashrate briefly hit new highs.
What Drove the Bitcoin Price Down
Three forces overlapped in Q1 and pointed the same direction. First, a hawkish repricing of Federal Reserve expectations re-coupled BTC to risk assets just as the Nasdaq rolled over. Second, spot Bitcoin ETFs flipped to sustained outflows — roughly $1.1 billion net out in January alone, per Bloomberg and CoinShares flow data — breaking a multi-month inflow streak. Third, a 15% single-day decline on January 29 (from ~$96,000 to ~$80,000) triggered stop cascades and leveraged long liquidations that the market took weeks to digest.
By early February BTC had printed its first sub-$63,000 close since September 2024. The CoinDesk report on the February 19 difficulty spike captured the contradiction of Q1 in one line: hashrate was still racing to new highs while spot was falling. The miner math only works when those two lines agree. In Q1 they did not.
Hashrate, Difficulty, Hashprice — the Miner's Trio
Three numbers matter more than BTC price for understanding mining economics. Think of them as a loop: hashrate is total mining competition, difficulty is the network's thermostat that keeps blocks near 10 minutes, and hashprice is what a miner actually earns per unit of work per day. When hashrate climbs faster than BTC price, hashprice falls. Q1 is a textbook example.
Hashrate
Peaked above 1.05 ZH/s (7-day avg) in mid-January. A severe US winter storm forced ERCOT-linked curtailment in Texas, shaving up to 30–40% from peak days. Ended Q1 near 950 EH/s per Hashrate Index.
Difficulty
On February 19 difficulty jumped +14.73% to 144.4 T — the largest percentage adjustment since China's 2021 ban, per CoinDesk. Three consecutive negative adjustments later in Q1 marked the first miner-capitulation streak since July 2022.
Hashprice
Slid from ~$42/PH/day in early January to ~$29–33/PH/day by March, a new post-halving low per Hashrate Index. For reference, hashprice peaked near $63/PH/day in July 2025.
The analogy: hashprice is the wage per hour for a Bitcoin miner, set by the network, paid in BTC. Q1 cut that wage by roughly a third while power bills stayed the same. The question for every operator became which side of the break-even line they were on.
Who Was Profitable, Who Wasn't — by Electricity Price
At a Q1-average hashprice of roughly $32/PH/day, an Antminer S21 (200 TH/s, 3,500 W) earned about $6.40 of BTC per day gross. Whether that produced a profit depended almost entirely on one number: cost per kWh. Below is the Q1 profitability picture across three electricity tiers. Figures are illustrative, not a forecast — hashprice, BTC price, and difficulty all move daily.
$0.04/kWh
Large-scale sites, Kazakh/Paraguayan grid
- Daily power
- ~$3.36
- Daily gross
- ~$6.40
- Net / day
- ~$3.04
Profitable. Healthy margin even on the worst Q1 days.
$0.06/kWh
Texas co-location, mid-tier hosting deals
- Daily power
- ~$5.04
- Daily gross
- ~$6.40
- Net / day
- ~$1.36
Thin margin. Break-even on worst Q1 days; one bad week wipes the month.
$0.10+/kWh
Residential plug rate in most of the US, EU
- Daily power
- ~$8.40
- Daily gross
- ~$6.40
- Net / day
- ~−$2.00
Loss. Home miners on old rigs or plug power were under water all quarter.
CoinShares pegged the Q4 2025 weighted-average cash cost to produce one BTC among public miners at ~$79,995. With BTC ending Q1 near $67,500, the industry was below cash break-even on average for the quarter — which is exactly what the record 32,000+ BTC sell-off by public miners was telling us.
$0.04/kWh was profitable. $0.10+/kWh was not.
The Q1 breakdown above shows why industrial sites stayed above water while home miners capitulated. NoxHash runs at $0.035/kWh industrial grid power in Kazakhstan on 12–18.5 J/TH rigs — start with a 2-day Basic Miner trial before committing to a paid plan.
Four Q1 Stories That Defined the Quarter
Outside the raw price and hashrate numbers, four industry stories shaped the quarter for miners. Together they explain why Q1 2026 will be remembered as the moment post-halving economics fully hit.
Record miner sell-off
Marathon, CleanSpark, Riot, Core Scientific and Bitdeer collectively sold 32,000+ BTC in Q1, exceeding total 2025 sales — the largest quarterly outflow on record, per CoinShares and Cointelegraph.
ETF flows flipped negative
US spot Bitcoin ETFs saw roughly $1.1 billion in net outflows in January 2026 (Bloomberg, CoinShares flow reports), breaking the prior trend of steady inflows. March briefly flipped back to net inflows after a commodity classification ruling on March 17.
AI / HPC pivot accelerated
Public miners signed over $70B in aggregate GPU co-location and cloud deals with hyperscalers by early Q1 — IREN, Core Scientific and others now carry multi-billion-dollar convertible debt tied to AI pivots, per Moving Markets and CoinShares.
ASIC prices compressed further
Antminer S21 XP Hydro units broke even around $56,000–58,000 BTC at $0.06/kWh, standard S21 around $62,000–64,000. Older rigs (S19, M30S) fell to scrap-adjacent resale prices as Q1 hashprice crushed their economics.
What Q1 Looked Like From Inside a Cloud Mining Operation
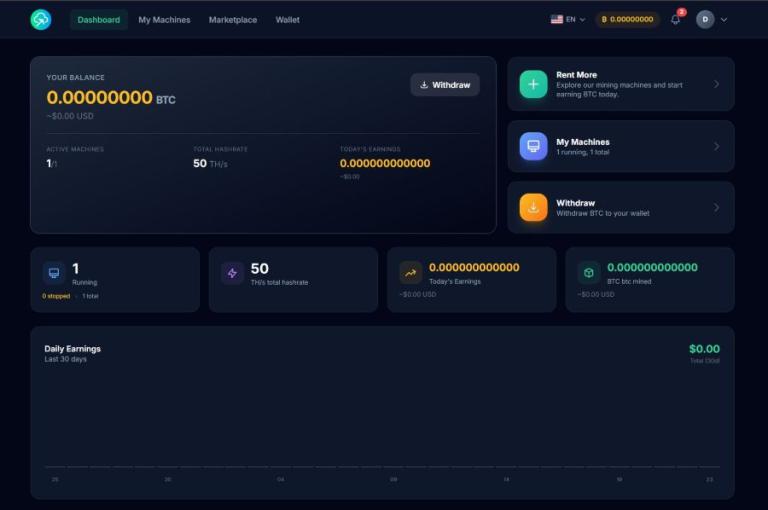
NoxHash sits at the $0.035/kWh industrial tier, running Antminer S21 series and WhatsMiner M60/M66 rigs at 12–18.5 J/TH — the left column of the profitability table above, not the right. That's the structural reason the facility stayed cash-positive through Q1 while home miners and higher-cost operators tapped the brakes or sold into the weakness.
The same dynamic is why the cloud-rental model absorbs market shocks better than home rigs. A user renting a Pro Miner in January pays a flat $100/month in USDT, locked in. Even when hashprice fell 25–30% during the quarter, the cost basis didn't move — and the underlying hardware is already inside an industrial grid contract. Compare that to a home operator who still owes $0.12/kWh on a fixed utility bill while hashprice grinds lower.
That is not a prediction that cloud mining wins every quarter. When BTC rallies and hashprice rips, a home miner with paid-off hardware and cheap solar can print money. The value of a professional operation shows in quarters like Q1 2026 — when the margin for error thins to zero and cost per kWh decides who survives.
What to Watch in Q2 2026
A profitability report is only useful if it sharpens the questions for next quarter. Four signals to watch between April and June:
Can hashprice reclaim $40/PH/day?
Q1 closed near $33. A durable move above $40 — driven by either a BTC recovery, falling difficulty, or a fee revenue bump — would relieve the post-halving squeeze and slow miner capitulation.
Do ETF flows re-stabilize?
January's $1.1B outflow turned into a partial rebound in March. Sustained Q2 inflows would be a BTC price tailwind; another outflow wave would put hashprice back under pressure.
Does public miner selling slow?
32,000 BTC sold in Q1 was partly balance-sheet defence. If Q2 selling pressure fades, it's a signal cash cost pressure has eased and the marginal miner has re-found break-even.
Fee revenue floor?
With the halving shrinking subsidy to 3.125 BTC per block, fee revenue is a growing share of miner income. Any resurgence in ordinals, runes, or on-chain activity in Q2 flows directly into hashprice.
Frequently Asked Questions
Was Q1 2026 profitable for most Bitcoin miners?
On average, no. CoinShares placed the Q4 2025 weighted-average cash cost to mine one BTC at around $79,995, and BTC closed Q1 near $67,500. Industrial miners at $0.04/kWh or lower generally stayed cash-positive; home miners at $0.10+/kWh were under water for most of the quarter.
Why did hashprice fall so sharply?
Two pressures stacked. BTC dropped more than 22% in Q1 while network hashrate briefly pushed above 1 ZH/s — more miners chasing a shrinking USD reward pool. Hashprice encodes both forces, so it fell faster than either input alone, landing near $29–33/PH/day by March.
When is the next Bitcoin halving?
The next halving is expected in 2028 and will cut block subsidy from 3.125 BTC to 1.5625 BTC. Until then, fee revenue share grows in importance — any quarter with strong ordinals, runes, or on-chain activity will meaningfully support hashprice and miner margins.
Are older ASICs still profitable after Q1?
Only with very cheap power. At $0.04/kWh, newer rigs in the 12–18 J/TH range remained profitable. S19 Pro (~30 J/TH) and similar 2021-era units were under water at most electricity prices above $0.05/kWh during Q1 — which is why a lot of them hit resale markets.
What's the Q1 2026 hashprice history in one sentence?
Hashprice slid from roughly $42/PH/day in early January to about $29–33/PH/day by late March, a new post-halving low per Hashrate Index, driven by a -22.6% BTC quarter against near-record hashrate and a +14.73% difficulty adjustment on February 19.
How does cloud mining change the Q1 calculus for an individual?
You swap a variable residential electricity bill for a fixed USD rental priced against industrial grid power. You still carry BTC price and difficulty risk — the part you can't outsource — but you don't carry hardware risk, utility risk, or the $4,500+ up-front ASIC outlay that looked a lot worse at the end of Q1 than at the start.
Not financial advice · Q1 retrospective, not a forecast
This report summarises Q1 2026 Bitcoin mining data from public sources (CoinDesk, CoinShares, Hashrate Index, Bloomberg, Cointelegraph) as of April 24, 2026. Profitability numbers are illustrative daily snapshots, not personal projections — BTC price, network difficulty, hashrate, hashprice and electricity costs all move continuously and sit outside any operator's control. Past quarterly performance does not guarantee future results. Bitcoin mining carries market, operational, regulatory and tax risk; only commit capital you can afford to lose, and consider a qualified local tax advisor for your jurisdiction.